Goethe University physicists develop free covid-19 analysis website to compare the number of cases and deaths by country
There is no lack of data on global corona developments. But if you want to actively compare countries yourself and relate case and death figures across countries, you can now get a quick overview with just a few clicks – and gain surprising insights in the process.
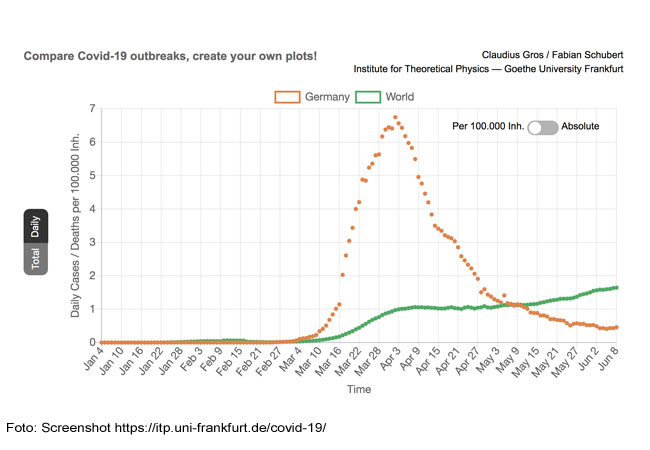
The new web service “Goethe Interactive Covid-19 Analyzer“ which Fabian Schubert in the working group for the theory of complex systems at the Institute for Theoretical Physics developed alongside his dissertation is simple to use: go to the “Goethe Interactive Covid-19 Analyzer” website, click on the countries and number of cases in questions, and drag the curves over each other. Congruent? The answer is immediately visible. In the same way – depending on the individual question – the daily number of cases or deaths, or the total number of infected or deceased individuals can be compared. The underlying data for countries from “A” as in Afghanistan through “Z” as in Zimbabwe is provided by the known covid-19 databases of the „European Centre for Disease Control” and the “Johns Hopkins Center For Systems Science and Engineering.”
“Our interactive tool allows researchers, journalists and other interested parties to quickly gain an overview of outbreak developments,” explains Professor Claudius Gros, who studies the modelling of covid-19 outbreaks himself at the Institute for Theoretical Physics, and who as Schubert’s doctoral advisor encouraged him to develop the service tool. Those who use the tool may also discover relationships that provide inspiration for additional research on epidemic processes.
Gros, for example, was surprised that the scaled trajectory curves of the case numbers from Germany and Spain “are almost identical, although the two countries pursued significantly different lockdown measures.” There are also interesting clues regarding the unexplained issue of the number of unrecorded cases of corona infections. For Italy, the scaled curve of covid-19 infections corresponds to the curve of corona deaths if the daily case numbers are applied to the total numbers of the sick or the deceased. “This indicates that the unrecorded case numbers may not have changed significantly over the course of the outbreak – even though testing increased.”
The “Goethe Interactive Covid-19 Analyzer” from the Institute for Theoretical Physics offers numerous options for combining data per mouse click. “The page has only been live for a couple of days,” says Gros. It therefore remains to be seen how many researchers and other interested parties will use the new analytical tool. The first scientists have already indicated interest, however. And the theoretical physicist is certain: “The website is certainly useful for the final papers and doctoral dissertations on covid-19 that will soon be written. And also for secondary school students who want to present a paper on corona.”
The new analytic tool is hosted on the webserver of the Institute for Theoretical Physics, which is also providing the necessary technical support.
Website: Goethe Interactive Covid-19 Analyzer: https://itp.uni-frankfurt.de/covid-19
Publication: Claudius Gros, Roser Valenti, Kilian Valenti, Daniel Gros, Strategies for controlling the medical and socio-economic costs of the Corona pandemic (2020); https://arxiv.org/abs/2004.00493


