How have water resources evolved during the last 120 years? What will happen if the temperature rises another two degrees by the end of the 21st century? These are the kinds of questions addressed by WaterGAP, a global water-modeling program developed by Goethe University Frankfurt’s Institute of Physical Geography and Ruhr University Bochum. To date, the data it generated were solely available to experts. Thanks to a new Web app developed by French geodata firm Ageoce in cooperation with Goethe University, that is set to change.

The image shown on a screen in Goethe University Frankfurt’s Geocenter shows a map of central Europe, with the entire land area covered with a patchwork of colored boxes – some of them blue, some green, others yellow or orange. “Each of these boxes – which we also refer to as cells – represents an area of around 50 kilometers by 50 kilometers,” explains geographer Dr. Hannes Müller Schmied. “The colors indicate how much new groundwater is formed there in one year. The closer the color gets to orange, the less new groundwater is created.” A few mouse clicks later and the brightly colored display changes – areas that were green are now predominantly yellow and orange. “The image I showed you before represented the situation in 1980,” says Müller Schmied. “What we see here is the situation in 2021, a year with less total precipitation and a somewhat different seasonal precipitation distribution. You can see significant variations in large parts of eastern Germany, Poland and Russia.”
Thunderstorms don’t do much for the groundwater
Our freshwater resources are increasingly coming under stress – not so much because the total amount of precipitation is changing, but because it is now distributed differently. “Many people find the wet weather we experienced in Germany in recent weeks depressing,” Müller Schmied says. “But this type of steady, long-lasting rain is good news for the soil and the groundwater.” In the last few years, however, long dry periods have become more frequent. Rainfall is often very concentrated: Sometimes, within just a few hours, the clouds release as much water as they would normally do over several weeks. “When this kind of downpour occurs, it doesn’t take long for the soil to lose its ability to absorb more water,” Müller Schmied emphasizes. Instead, this valuable resource drains into streams and rivers and then flows into the sea – with very little arriving in the soil and ultimately in the groundwater. “A severe thunderstorm doesn’t do much for the groundwater. By contrast, two weeks of steady rain with exactly the same quantity of water is just perfect.”
Fluctuating precipitation patterns are not the only cause of water shortages, temporary or otherwise, at many places in Germany. Numerous other factors also influence regional water availability, such as the proportion of winter precipitation stored in glaciers and as snow, which is released again in the spring thaw. Other factors include how strong the insolation is, which in turn determines evaporation, or how thickly wooded an area is (forests shade the ground and help water seep into the soil; beyond that, their crown also stores water). Still other components include how intensively the resources are used for irrigating agricultural crops, for livestock, industry, or for meeting the water needs of households. For going on 30 years, researchers have been investigating these influences by creating computer models. After all, having sufficient water is essential not only for human beings, but also for functioning ecosystems and the organisms that live in them. One of the models enjoying widespread popularity worldwide is WaterGAP, the acronym for “Water – Global Assessment and Prognosis.” WaterGAP was launched nearly 30 years ago at the University of Kassel. Since then, the model has been continually refined and developed – now principally at Goethe University Frankfurt and Ruhr University Bochum.
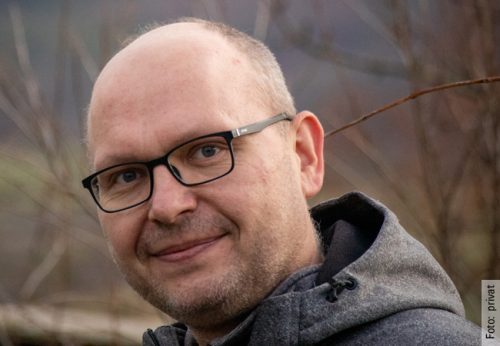
Hannes Müller Schmied is part of the Frankfurt-based WaterGAP team. The colorful graphics on his screen are based on the model’s calculations. “Measuring the generation of new groundwater is very hard work, also because it can only be done at one specific location and not in large areas,” he says. “Yet, this information is extremely important when it comes to determining things like how sustainable it is to irrigate a large area from groundwater reserves.” Models like WaterGAP mirror the processes that influence water availability – using software, they can calculate time series with spatial and temporal resolution for a range of variables in the water cycle. This allows researchers to estimate both the current status and the historical development of water resources for almost any region on our planet, albeit not absolutely exact.
Complex geodata
To date it took experts to distil answers to specific questions from the plethora of model calculations. “We use complex programs to analyze and ultimately visualize our model’s results,” Müller Schmied explains. Thanks to a cooperative arrangement with Ageoce, that is about to change. The French company specializes in preparing complex geodata so they can be viewed in a standard internet browser. The two maps of Europe showing the formation of new groundwater in 1980 and 2021 were created using this Web app. “We want to help ordinary people understand how water resources have developed during recent decades,” stresses Ageoce managing director Dr. Guillaume Attard. “Our corporate mission is to fill the gaps between research and operational environmental technology, including by translating research data into a format that everyone can use. WaterGAP is an ideal example of this.” The data visualization also enables laypersons to find answers to concrete questions – e.g. how has the water situation in the region where I live changed since I was born? How much of this change is due to human influence? “One of our goals is to raise awareness of the problem – both among the general public and among policymakers,” says Attard, whose native country France has suffered just as much as Germany from numerous droughts in recent years.
Research data in the library
Goethe University’s Central Library is also involved in the cooperative project. It recently launched a platform for publishing research data – the Goethe University Data Repository (GUDe) –, which is accessible to all scientists. “We use GUDe to store the results of the model in a structured manner and make them available to the public,” Müller Schmied explains. The French partner can access the data on the internet via a standardized application programming interface (API). When Müller Schmied generates new data (the model calculations for 2023 are due to be uploaded onto GUDe soon, for example), Attard will be able to integrate them into his Web app with just a few mouse clicks. “Our joint project also illustrates how GUDe can greatly simplify such cooperative schemes,” Müller Schmied points out.
WaterGAP’s research usage is not limited to investigating the historical development of water resources. Another special focus is the effects of certain climate scenarios: “We’re interested in questions like what will happen to water availability to human beings and the environment, if the global temperature really rises by 2, 3 or 5 degrees. Where are potential climate change hotspots emerging, which merit more detailed examination? And what role do direct human interventions play, e.g. the construction of reservoirs or the use of water by households, agriculture and industry”, Müller Schmied asks. The current version of the Web app does not enable him to peer into the future – yet. That could change soon, as the geographer is planning to apply for funding to further develop the visualization platform.
Author: Frank Luerweg


